Crime Data
NeighborhoodScout Crime Analytics use hundreds of sophisticated spatial algorithms to process 9 million+ reported crimes into nationally comparable crime data of unprecedented accuracy, with complete coverage for every neighborhood and address in America.
How You Can Use Crime Analytics:
- Investing or lending: violent crime risk is the #1 cause of low property values in urban neighborhoods
- Know crime risk for every address/neighborhood
- Easily compare crime across neighborhoods with comparable crime scoring
- Unlock crime trends and forecasts to see if any location is declining or rising
What’s Unique About NeighborhoodScout Crime?
- Crime risk scores for each type of crime in every neighborhood: Murder, rape, robbery, assault, burglary, theft, and motor vehicle theft
- Up to 98% accurate neighborhood crime risk scoring
- Seamless 100% U.S. coverage. Enter an address, get a full crime report
Where Does the Data Come From?
What We Collect

Raw Data
- 18,000+ law enforcement agencies
- 9.4 million crime incidents
- Full national coverage
What We Do

Product Building
- Proprietary relational data base processes crimes to locations
- 120+ crime risk models built
- Hierarchical scale methodology, from city to neighborhood
What We Provide

Product Output
- NeighborhoodScout.com
- Enterprise Data APIs
Demographics
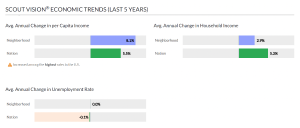
Demographics shape the fates of nations, cities, and neighborhoods. NeighborhoodScout Demographic Analytics derive insights from hundreds of raw inputs to produce one-of-a-kind data patterns for population, migration, lifestyle suitability, walkability, cultural character, education, incomes, ages, employment, diversity, and more. Indexed against national averages for comparison. Coverage for every neighborhood and address in America.
How You Can Use Demographic Analytics:
- Investing: The types of households in a neighborhood – singles versus families, and peoples’ transience, drive demand for specific kinds of apartments and houses
- Builders, marketers and others can know the cultural character of any neighborhood, instantly
- Takes the guess-work out of understanding any neighborhood’s wealth, sophistication, and values, assess comparables, unlock opportunity
What’s Unique About NeighborhoodScout Demographics?
- Complete lifestyle segmentation from college student friendly, to retirement and all stages in between
- Cultural character is quantified: urbane, hip, quiet, walkability, nautical
- Neighborhood-specific unemployment, diversity index, and more. Seamless 100% U.S. coverage. Enter an address, get a full demographics profile report
Where Does the Data Come From?
Raw Data

What We Collect
- 8.5 million raw demographic data elements from government sources in total
- Full national coverage
What We Do

Product Building
- Dozens of custom models to build raw data into exclusive analytics
- Gini coefficient and other sophisticated methods used to create proprietary indices and insights
- Scaled against national benchmarks for ease of comparison
What We Provide

Product Output
- NeighborhoodScout.com
- Enterprise Data APIs
Real Estate Data
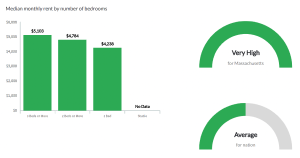
NeighborhoodScout Real Estate Analytics provides the only micro-neighborhood housing market insights with exclusive market rent prices by number of bedrooms, house values, property taxes and effective tax rate, years of average rent needed to buy the average house, housing stock profiles, physical neighborhood setting, seasonal and year-round vacancy rates, owner/renter mixes, and more, all in one place. For every neighborhood and address in America.
How You Can Use Real Estate Analytics:
- Buying, selling, assessing, lending:
- Know if you are buying or lending on the biggest house in the neighborhood
- Vacancies reveal lack of demand, housing stock shows if new construction is adding supply
What’s Unique About NeighborhoodScout Real Estate Analytics?
- All pricing, tax, and rental values accurate to the micro-neighborhood: 10X more fine grained than the average Zip Code:
- Exclusive market rent values modeled to exclude public housing, revealing what rents the market will support
- Exclusive years of average rent needed to buy average home illuminates whether investing in rental property is a good or bad prospect in any neighborhood
Where Does the Data Come From?
What We Collect

Raw Data
- U.S. Geological Survey, H.U.D., FHFA, Census, additional sources
- Full national coverage
What We Do

Product Building
- Dozens of proprietary models using multi-source data
- Cross-scalar composite modeling
- Normalized indices for benchmarking and comparison
What We Provide

Product Output
- NeighborhoodScout.com
- Enterprise Data APIs
Public School Ratings
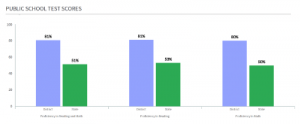
NeighborhoodScout School Quality Ratings provide the only nationally comparable school quality rating available today. Promotes easy benchmarked comparison of school quality between schools, school districts, property addresses, and neighborhoods in any state or location. For every neighborhood, address, school district, and most schools in America.
How You Can Use Public School Ratings:
- School quality is a primary driver of real estate values, and real estate in top performing attendance zones holds value in economic downturns better than low performing schools.
- Lenders and appraisers can use the benchmarked school performance data to value assets.
- Investors can balance risk with opportunity by including school performance in evaluations.
What’s Unique About NeighborhoodScout Public School Ratings?
- The only nationally comparable school performance ratings available today. Patented.Lenders and appraisers can use the benchmarked school performance data to value assets.
- 100% school district coverage•
- 85% individual school attendance zone coverage
- Address-specific school quality ratings
- Neighborhood-specific school quality ratings with 100% U.S. coverage
Where Does the Data Come From?
What We Collect

Raw Data
- 103,000 public schools, 17,000 school districts, 50 states
- National Center for Education Statistics
- U.S. Department of Education
- NAEP
- 5.4 million data elements
What We Do

Product Building
- Patented methodology normalizes each school to a nationally comparable performance index
- Each U.S. address is assessed based on its school district, and the schools that serve the address, and the educational environment of its neighborhood
- Seamless 100% U.S. coverage of neighborhood-specific school performance ratings
What We Provide

Product Output
- NeighborhoodScout.com
- Enterprise Data APIs
Scout Vision™ Trends & Forecasts
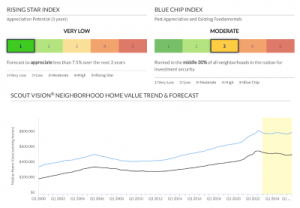
Scout Vision Trends & Forecasts offer the most timely and accurate home price and home appreciation rate predictions for every micro-neighborhood in the U.S. With Scout Vision you can confidently answer: “Should I buy, hold, sell or lend on this property, at this location, at this time?”
Industry veterans and PhD geographers developed Scout Vision by drawing on over a decade of research and employing a fresh approach that leverages cutting-edge geo-statistical techniques and theory. As a result, Scout Vision uniquely solves for risk and highlights otherwise hidden opportunities by delivering micro-neighborhood home price appreciation trends - and projections - with unprecedented geographic granularity and predictive accuracy.
How You Can Use Scout Vision™ Trends & Forecasts
- Get hyper-local by uncovering the three-year appreciation forecast for different micro-neighborhoods inside the same city or between cities, anywhere in America. Location matters, not just what city or Zip Code a property is in.
- Determine how a location’s past and future appreciation rates at a hyper-local level compare to appreciation rates experienced in that metro area overall and the U.S. average. By selecting a time period, you can immediately see which neighborhood’s homes appreciate the most through both up and down real estate markets, providing exclusive insights into which neighborhoods are likely good investments for the future.
What’s Unique About Scout Vision™ Trends & Forecasts?
- The only three-year property appreciation forecast available today at 10X smaller than a Zip Code, with up to 90% predictive accuracy.
- Highest-resolution available in the market today: Exclusive appreciation forecasting at the micro-neighborhood level (nearly 10X smaller than a Zip Code).
- 100% complete, seamless national coverage. Every address is covered.
Where does the data come from?
What We Collect

Raw Data
More than 200 data elements from dozens of sources including:
- U.S. Department of Education
- 50 State Departments of Education
- U.S. Bureau of Labor Statistics
- Dow Jones S&P
- Federal Bureau of Investigation
- 18,000+ Local Law Enforcement Agencies
- FHFA
- U.S. Bureau of the Census
- U.S. Department of Housing and Urban Development
- U.S. Geological Service
- U.S. Department of Transportation
- LEHD Origin-Destination Employment Statistics
- Federal Highway Administration
- National Agricultural Statistics
What We Do

Product Building
- Custom developed spatial statistics at multiple scales applied to every Micro-neighborhood, MSA and non-metropolitan economic region in the U.S. with hierarchical techniques.
- 200+ variables used to build 23 custom, geographically-nested multivariate models, each fully back tested over 16 years for complete validation, based on data that spans nearly half a century.
- 218,000 Micro-Neighborhoods (nearly 10X smaller than a ZIP code)
- 100% Seamless national coverage
What We Provide

Product Output
- NeighborhoodScout.com
- Enterprise Data APIs and Bulk File Processing


